Every once and a while, an existing DAX function won’t meet exact specifications; when this happens you’ve got to think out side the box. In this case we want to use RANKX avoiding ties.
What Can This Technique Add to My Reports?
Easy Ranking System
The base of the ranking measure we will write can be used to create a simple and dynamic ranking system within a table based off of a single KPI.
Sub-Ranking and Proper Sorting
A simple addition to your ranking measure can ensure that your secondary sorting is displayed properly and can be used to break ranking ties.
Understanding RANKX in DAX
This is the syntax for RANKX:

The first parameter is a DAX table over which the expression is evaluated. The second parameter, <expression>, is a numerical value that the ranking will be sorted by. The <value> parameter is not often used as its purpose is to return a single scaler value whose rank is to be found. There are not many use-cases for this. The <order> parameter allows you to determine whether the return ranking should be sorted ascending or descending. Finally, the <ties> parameter doesn’t actually break ties but instead determines whether there should be gaps in your ranking in the event of a tie or whether the next value is sequential.
A Look At Our Data
Sales ranking tables are commonly used by companies to identify top performers, provide transparency, and spur competition among sales reps. In this example we are using a dataset that house information about projects being sold by a sales team. As you can see, we have a list of all sold projects, which sales rep sold the project, how many units were sold, and the project revenue.

We are attempting to build a repot that will provide a ranking of the sales reps. The primary ranking system utilizes the number of projects sold by a sales rep. Now it would be easy to create such a ranking system. First, we would need a measure to count the total number of projects sold.

Then we would need to create a calculated column to add this measure to our Sales table so that we can reference it later in our rankings measure.

And finally, we could write a measure using RANKX to rank our sales reps by the number of projects they had sold.

Next we create a table visual with our ranking measure, our Sales Reps, and our KPIs (Projects Sold and Revenue).
However, the problem with our ranking measure is that it cannot account for ties or provide a secondary ranking such as on revenue. You can see in that there are many sales reps who have sold the same number of projects but with vastly different revenues.
As a quick example, notice that both Lesly Cockney and Pammy Leftly sold 5 projects. However, Pammy Leftly’s projects generated over 2 million more in revenue. It would make no sense to rank them the same and even worse, this table displays Pammy lower than Lesly, even though their ranking is the same.

Quick DAX Trick for Secondary Ranking
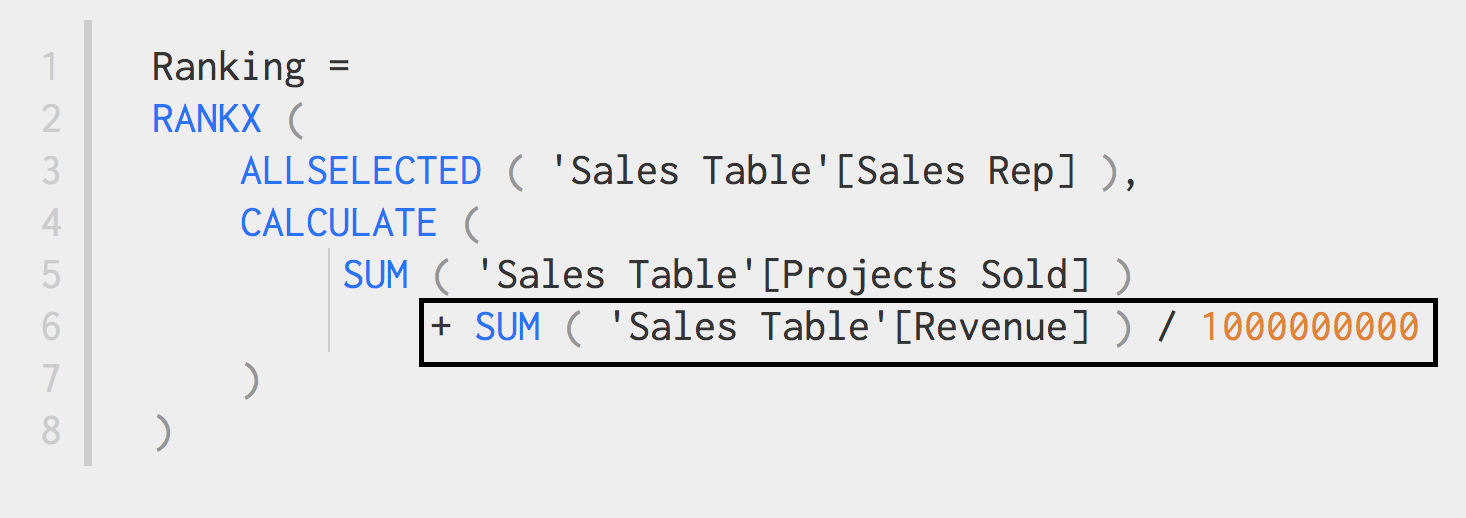
This is where we need a secondary ranking method that utilizes Revenue. A simple trick is to divide the revenue by a very large number to create a very small (less than 1) decimal number. We can then add this very small decimal number to Project Sold and rank based off of that. In our example our very large number will be 1 billion.

You can now see in our rankings table that there are no longer any ties in the ranking column and that in the case of Projects Sold being the same, it is sorted by the Revenue Generated column.

While this implementation is quite simple, the idea is that DAX allows you to get creative in your solutions…. We hope that this one example might remind you to get creative next time your needing to innovate.


