Skip to content
Data is everywhere. It’s in your sales, your website, your customer calls, and your shipping logs. But if you’re like most business leaders, it can feel like you’re buried in numbers without a clear way to use them.
That’s where AI-driven data visualizations come in. And at FreshBI, we make those visualizations work for you.
This article will explain what AI data visualizations are, how they help you grow, and why FreshBI is your best partner for turning data into decisions.
What Is AI Driven Data Visualization?
Let’s break it down.
- Data Visualization means turning numbers into pictures. Think of a pie chart, a bar graph, or a dashboard that shows how your business is doing.
- AI (Artificial Intelligence) is smart computer software that learns from patterns. It finds answers fast even in a sea of data.
When you mix the two, you get AI-driven data visualizations. These are smart visuals that don’t just show numbers – they show meaning. They answer your questions before you ask them. They adapt as your business grows.
Instead of reading a 30-page report, you can look at one dashboard and know exactly what’s going on.
Imagine asking your computer:
- “Why are my online sales down today?”
And it responds:
- “Online sales are down today because your ad click-through rate dropped by 27% this morning, especially on mobile. Your top-performing campaign from last week had a higher engagement rate, consider reactivating it.””
That’s the kind of clarity FreshBI helps deliver – through custom-built dashboards powered by AI and tailored precisely to your business. We don’t sell tools. We work with your team to design the right visual solutions so you get real answers when it matters most.
Why Businesses Need It Now More Than Ever
Every business today runs on data. But very few know how to see it, read it, and use it fast.
Here’s what AI-driven visuals solve:
1. Too Much Data, Not Enough Clarity
Most companies collect thousands of data points. Sales numbers. Customer messages. Website clicks. Inventory levels. And more.
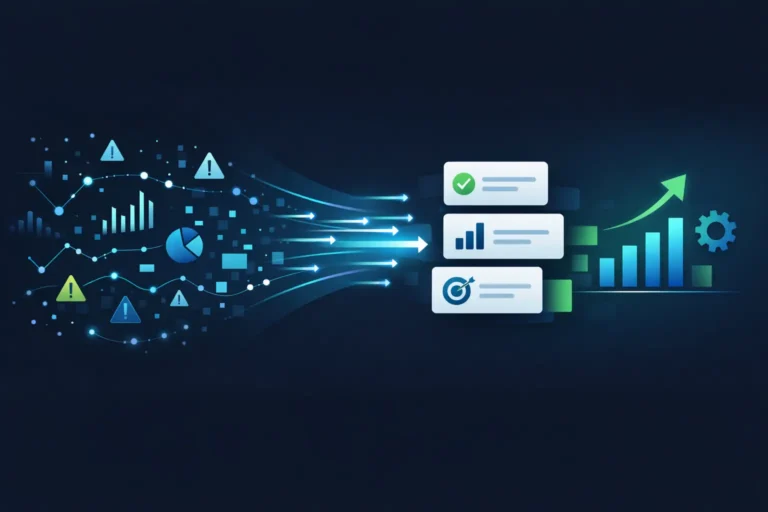
Without smart visuals, it’s just noise. AI cuts through the clutter and shows you what matters.
Example:
You run a store with 10,000 products. AI highlights the 10 that are losing money and why.
2. Slow Decisions = Lost Money
Manual reports take time. By the time they’re done, the problem may have changed.
With FreshBI dashboards, AI keeps your data up to date in real time. You can act fast.

Example:
A logistics company uses FreshBI to spot delivery delays before customers complain—saving time, money, and trust.
3. Missed Patterns = Missed Profits
AI sees trends the human eye can’t catch. Maybe your best sales days are always tied to weather. Or maybe your churn rate goes up when your support team is short-staffed.
AI finds these links—and shows them to you in simple charts.
Example:
A telecom provider used AI visualizations to reduce customer loss by 15% just by adjusting their support hours.
How AI Picks the Right Charts for You
Not every chart is the same. A pie chart might be great for showing part of a whole. A line chart might be better for time trends.
But how do you know what to use?
FreshBI’s AI knows. It:

- Looks at your data type (numbers, dates, locations, etc.)
- Understands your business goals
- Chooses the best way to display what matters
This means you don’t waste time guessing. You get the right chart, every time. And it’s always clear and easy to read—even for someone who doesn’t like numbers.
From Boring Reports to Living Dashboards
The Old Way:
You wait a week for a spreadsheet.
You open a file.
You scroll through columns.
You try to guess what’s wrong.
The New Way (with FreshBI):
You open your dashboard.
You see today’s live numbers.
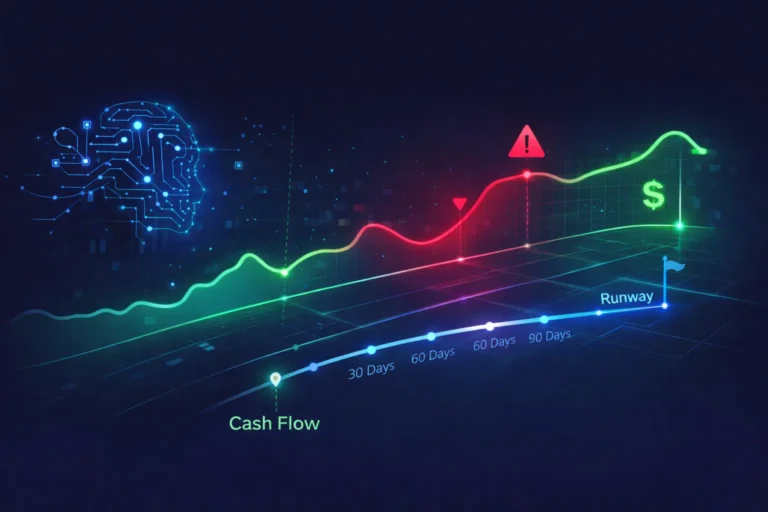
You spot a red warning: “Revenue dropped 12% this morning.”
You click it. AI shows a chart and a note: “Drop linked to lower ad traffic on Facebook.”
That’s a living dashboard..

It’s not just a picture—it’s a conversation. A dashboard that talks to you, updates itself, and helps you take action fast.
And FreshBI connects it all—from your CRM to your spreadsheets to your cloud apps.
Better Conversations With Your Data
Data isn’t just for analysts anymore. With FreshBI, anyone on your team can ask simple questions and get powerful answers—fast.
Let’s say you’re the sales manager. You want to know:
“What happened to leads from last week’s event?”
Instead of digging through reports or emailing the data team, you just ask. The AI finds the answer, builds a chart, and shows the results.
Now your whole team becomes data-smart—without needing to be data scientists.
Use Cases: How Smart Dashboards Change Real Businesses
Here are a few real-world ways companies use FreshBI:
1. Inventory Control Made Easy
A retail chain connected their warehouse system to FreshBI. The AI noticed items that weren’t moving and sent alerts to stop over-ordering.
Result: Saved over $120,000 in 3 months.
2. Faster Finance Tracking
A CFO wanted to know if they were overspending on contractors. FreshBI pulled invoices, sorted vendors, and showed a trend line in one click.
Result: Cut external costs by 9% in one quarter.
3. Marketing Insights That Actually Work
A small SaaS company ran three ads. FreshBI showed that one ad got 3x more sign-ups from mobile users. They shifted the budget right away.
Result: Doubled ROI in two weeks.
These are not dreams. These are results—made real through AI + visualizations.
What Makes FreshBI Different?
There are many tools out there. But here’s why FreshBI stands out:
Tailored for Business Leaders
We don’t give you generic dashboards. We build the right one for you—based on your industry, your systems, and your goals.
Real Experts. Real Help.
Our team walks with you. We ask the right questions. We set it up fast. And we train your team so you get value from day one.
Built for Action, Not Just Looks
Pretty charts are nice. But FreshBI focuses on insights that move the needle. Revenue. Cost. Time. People. We show you what’s working, what’s not, and where to focus next.
Privacy and Speed Matter
Your data stays safe. And your dashboards are lightning fast—even on mobile.
Want to see how it works?
Explore FreshBI’s services or see our AI models
The Future of Business Is Clear
In a world of fast change, you need to see clearly. You need to act fast. And you need to trust your data.
AI-driven data visualizations give you all three.
- They turn mess into meaning.
- They turn confusion into clarity.
- And with FreshBI, they turn your business into a faster, smarter, stronger version of itself.
You don’t need to be a tech expert. You don’t need to wait for a monthly report.
You just need the right partner.
Let FreshBI show you what your data is really saying—so you can make decisions that lead.
Ready to see what AI can do for your business?
Talk to FreshBI today.